







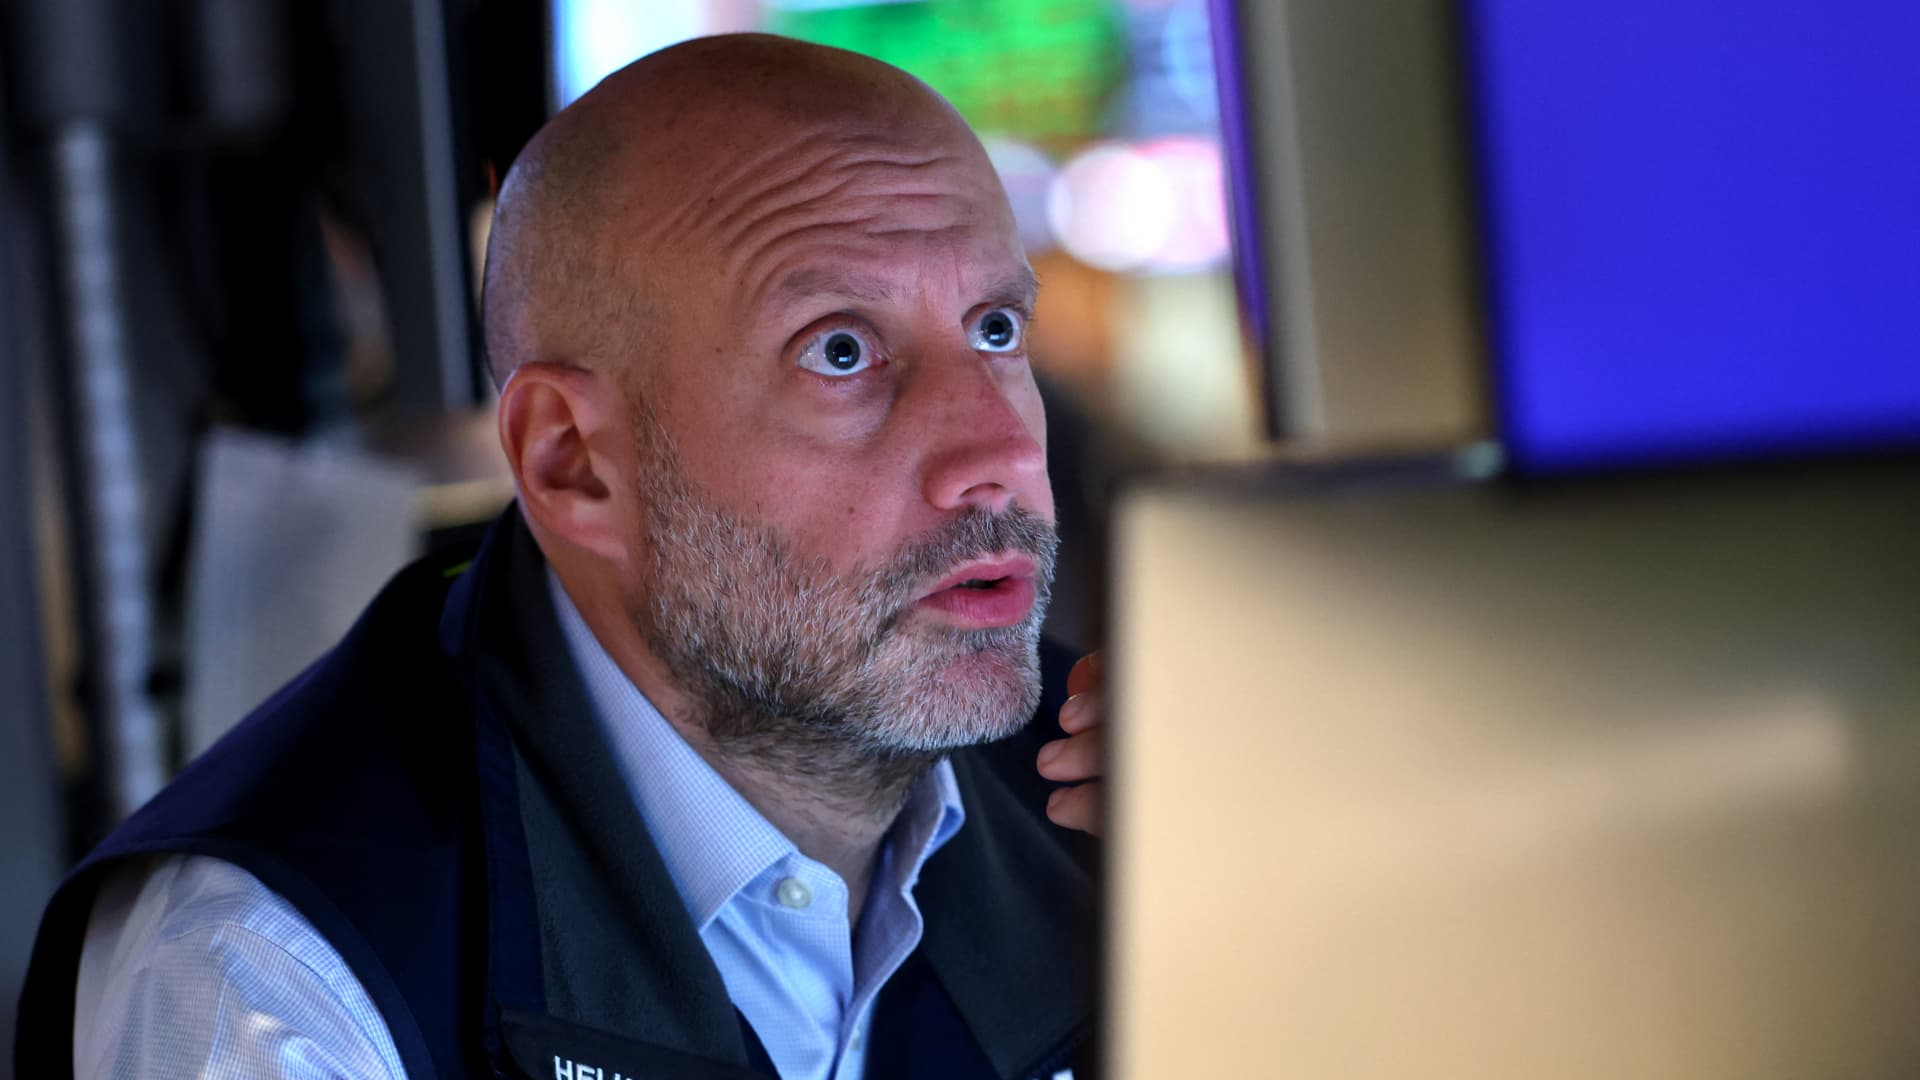
A trader works on the floor of the New York Stock Exchange (NYSE) at the opening bell in New York City on November 4, 2026.
Timothy A. Clary | Afp | Getty Images
Stocks suffered a major sell-off on Thursday as investors’ fears about a slowdown in the buildout of artificial intelligence rocked not only the trade itself but also the broader market.
The tech-heavy Nasdaq Composite receded more than 5% and finished in correction territory alongside the small-cap Russell 2000 index. The blue-chip Dow Jones Industrial Average retreated more than 1,800 points, or more than 3%, and the broad market S&P 500 pulled back more than 4%.
Those moves gave back the big gains seen in Wednesday’s postelection rally and then some.
Here are the most breathtaking statistics from the day’s rout:
- The Nasdaq Composite posted its worst performance in a single day since April 4, 2025, when it fell 5.82%
- The S&P 500 notched its worst single-day performance since April 4, 2025, when it declined 5.97%
- The Dow Jones Industrial Average secured its worst day since April 4, 2025, when it dropped more than 2,200 points, or 5.5%
- The “Magnificent Seven” lost more than $1 trillion in aggregate market cap, with Nvidia leading the way at a loss of more than $440 billion
- Nvidia fell more than 9% and turned negative on the year, with its year-to-date fall now at 2.6%
- On a point basis, the CBOE Volatility Index (VIX) — which hit its highest level since March 31 — gained 11.57 points for the biggest point gain since April 4, 2025, when the VIX gained 15.29 points
- On a percentage basis, the VIX closed up 69.66% for the third-biggest gain on record dating back to 1990
- On the New York Stock Exchange, declining stocks outpaced advancing stocks 2,344 to 416, or almost 6 to 1
- On the Nasdaq Composite, declining stocks outpaced advancing stocks 4,166 to 855, or almost 5 to 1
- All 11 S&P 500 sectors were negative, led to the downside by information technology, down 7.30% to post its worst daily performance since March 16, 2020, when it fell 13.92%
- Industrials fell 4.12%, its worst daily performance since April 4, 2025, when it fell 6.29%
- The Technology Select Sector SPDR Fund (XLK) fell 8.04%, turning in the worst daily performance since March 16, 2020, when the XLK fell 13.81%
- The XLK traded more than 33 million shares, more than three times the 30-day average volume of 9.2 million shares
- 174, or 34.6%, of stocks in the S&P 500 are 20% or more below the 52-week high, including SanDisk, Intel, Marvell Technology, Seagate Technology, Coinbase, Lumentum, Oracle, On Semiconductor, Micron Technology, Caterpillar, Robinhood, Alphabet, Nvidia, Lululemon
- 310, or 61.6%, of stocks in the S&P 500 are 10% or more below the 52-week high
- 59, or 58.4%, of stocks in the Nasdaq-100 are more than 20% off the 52-week high, including Rocket Lab, CoreWeave, Arm Holdings and SpaceX, among others
- 72, or 71.3%, of stocks in the Nasdaq-100 are more than 10% off the 52-week high